Hello,
i have some problems with a stable connectivity and with some Logs. I hope someone can help me with this problemes.
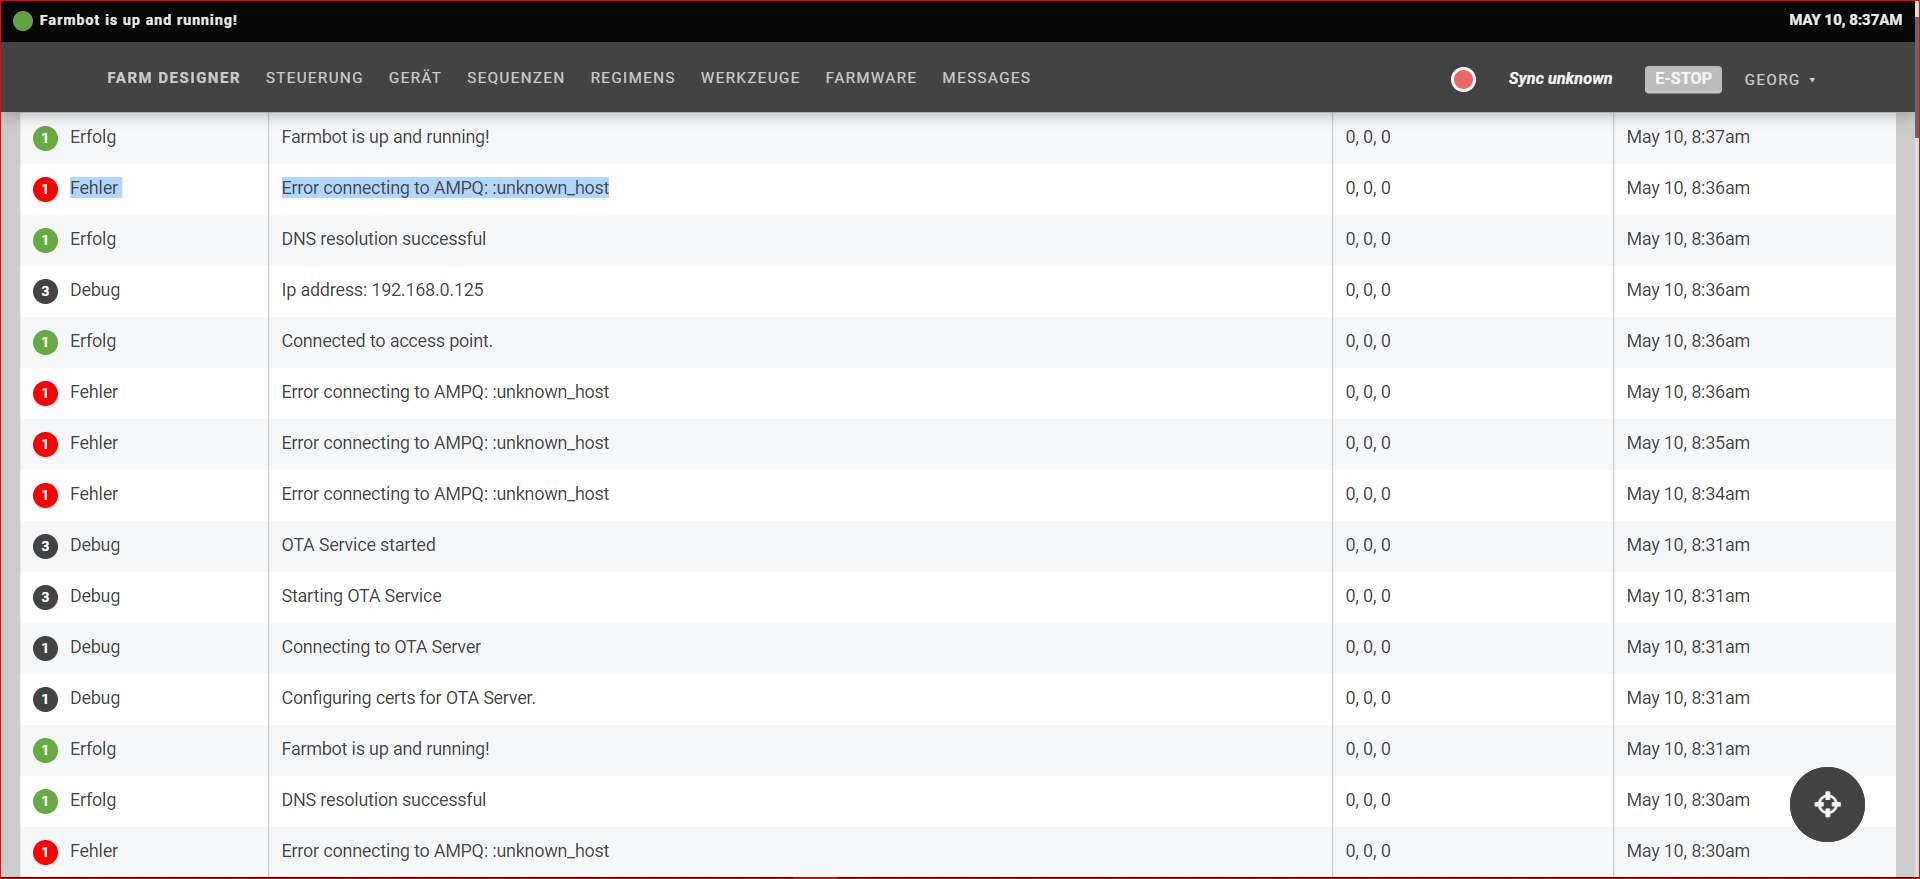
Fehler Error connecting to AMPQ: :unknown_host
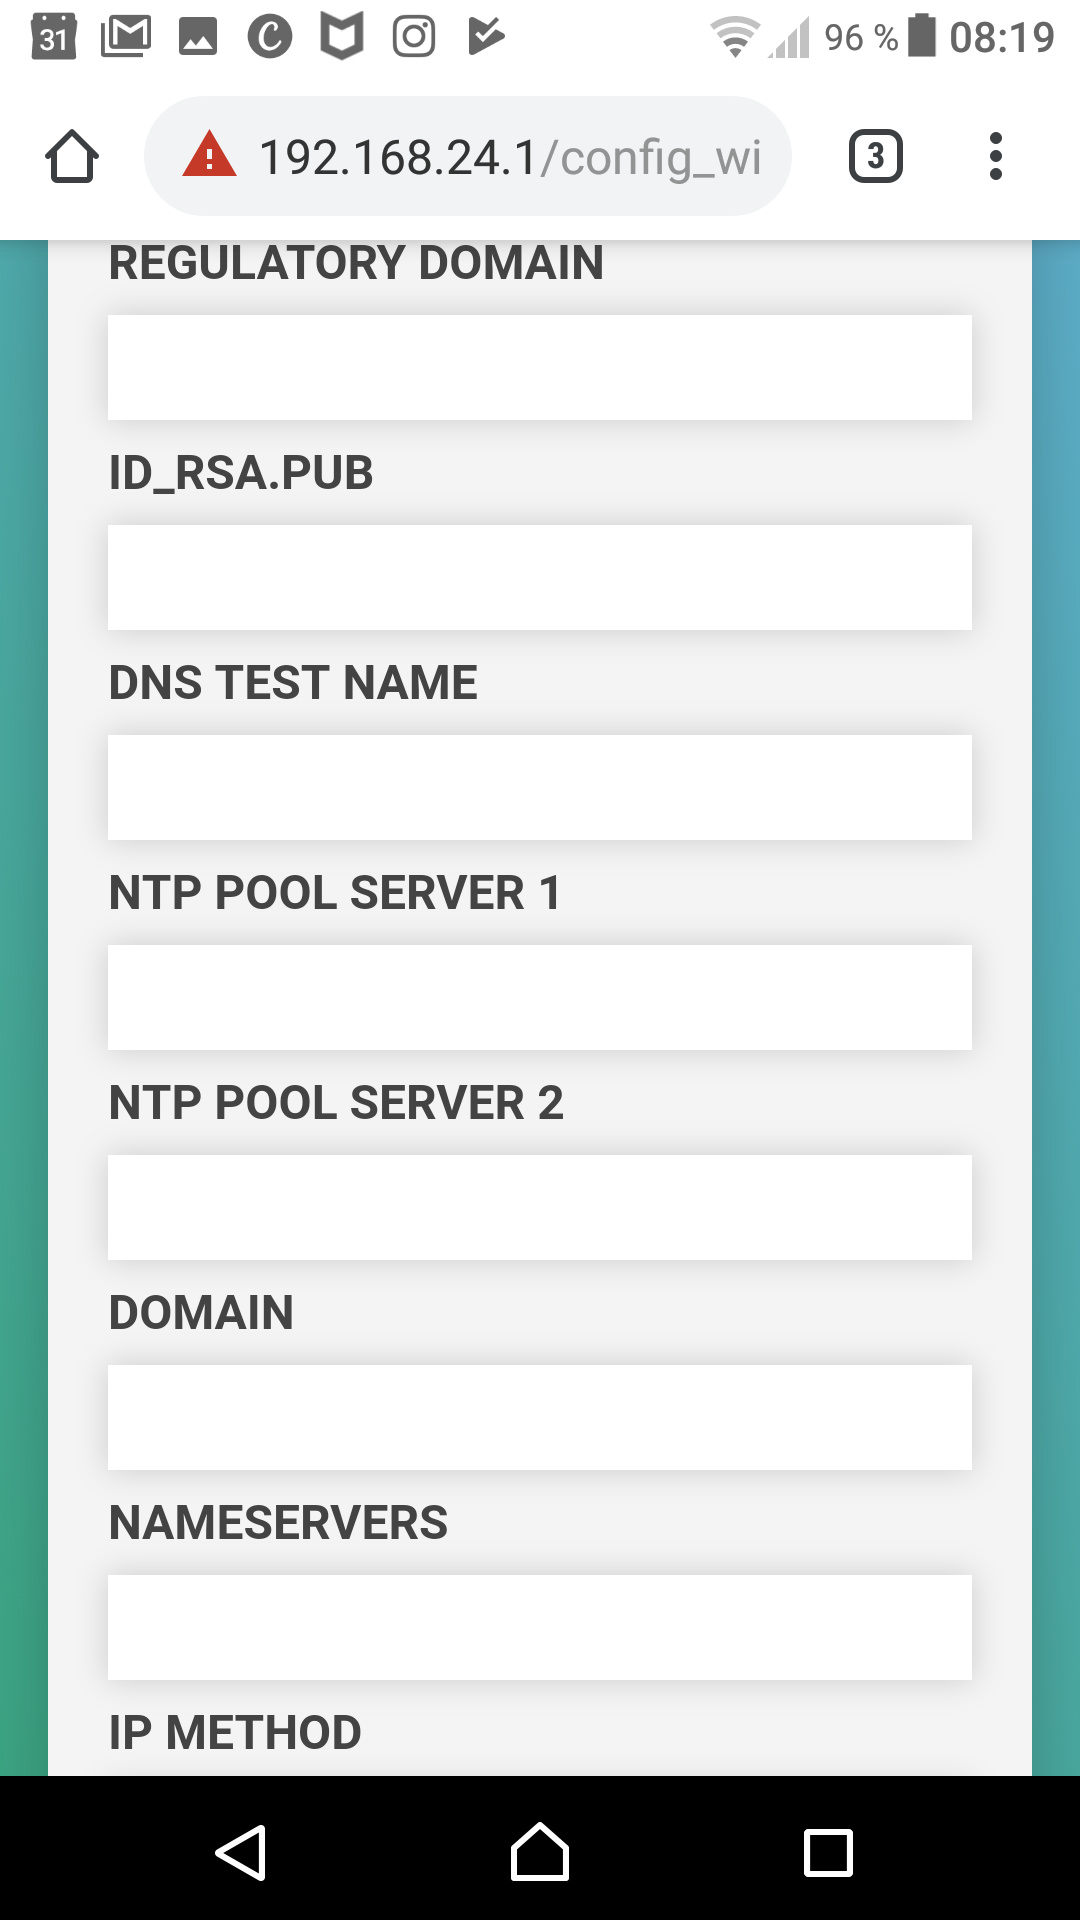
which setting should i use ?
with best regards Georg
Hello,
i have some problems with a stable connectivity and with some Logs. I hope someone can help me with this problemes.
Fehler Error connecting to AMPQ: :unknown_host
which setting should i use ?
with best regards Georg
Are you on a school or corporate network?
Are you behind a firewall?
Are you connecting using WiFi or hard wire Ethernet?
Hi @Georg,
You should have success without using any Advanced Settings. (i.e. just allow DHCP to setup IPv4)
@Georg If you use a firewall, please take a look at this document, it will help you identify hosts that require whitelisting:
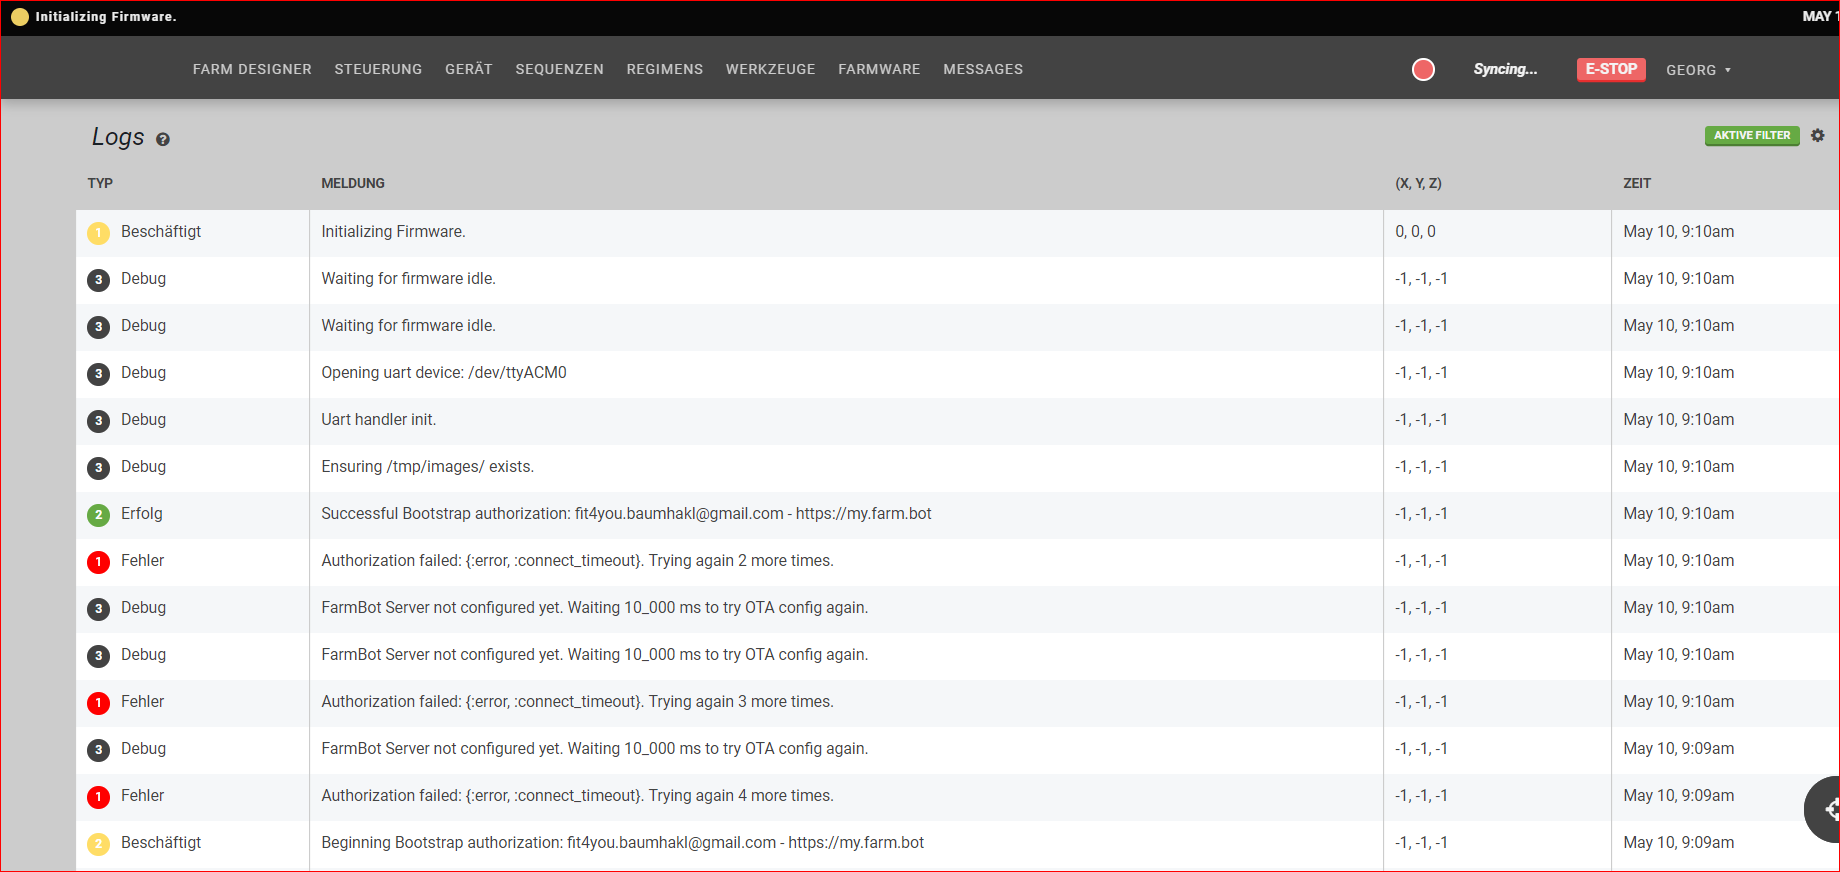
I’m also experiencing network connectivity issues with these logs:
Error connecting to AMPQ: :unknown_host
Failed to resolve https://my.farm.bot: {:error, :timeout}
Authorization failed: {:error, :nxdomain}. Trying again 4 more times.
Sometimes i need to reboot (code 26), sometimes the network comes back…
Practically, i can’t almost never run a sequence without an error.
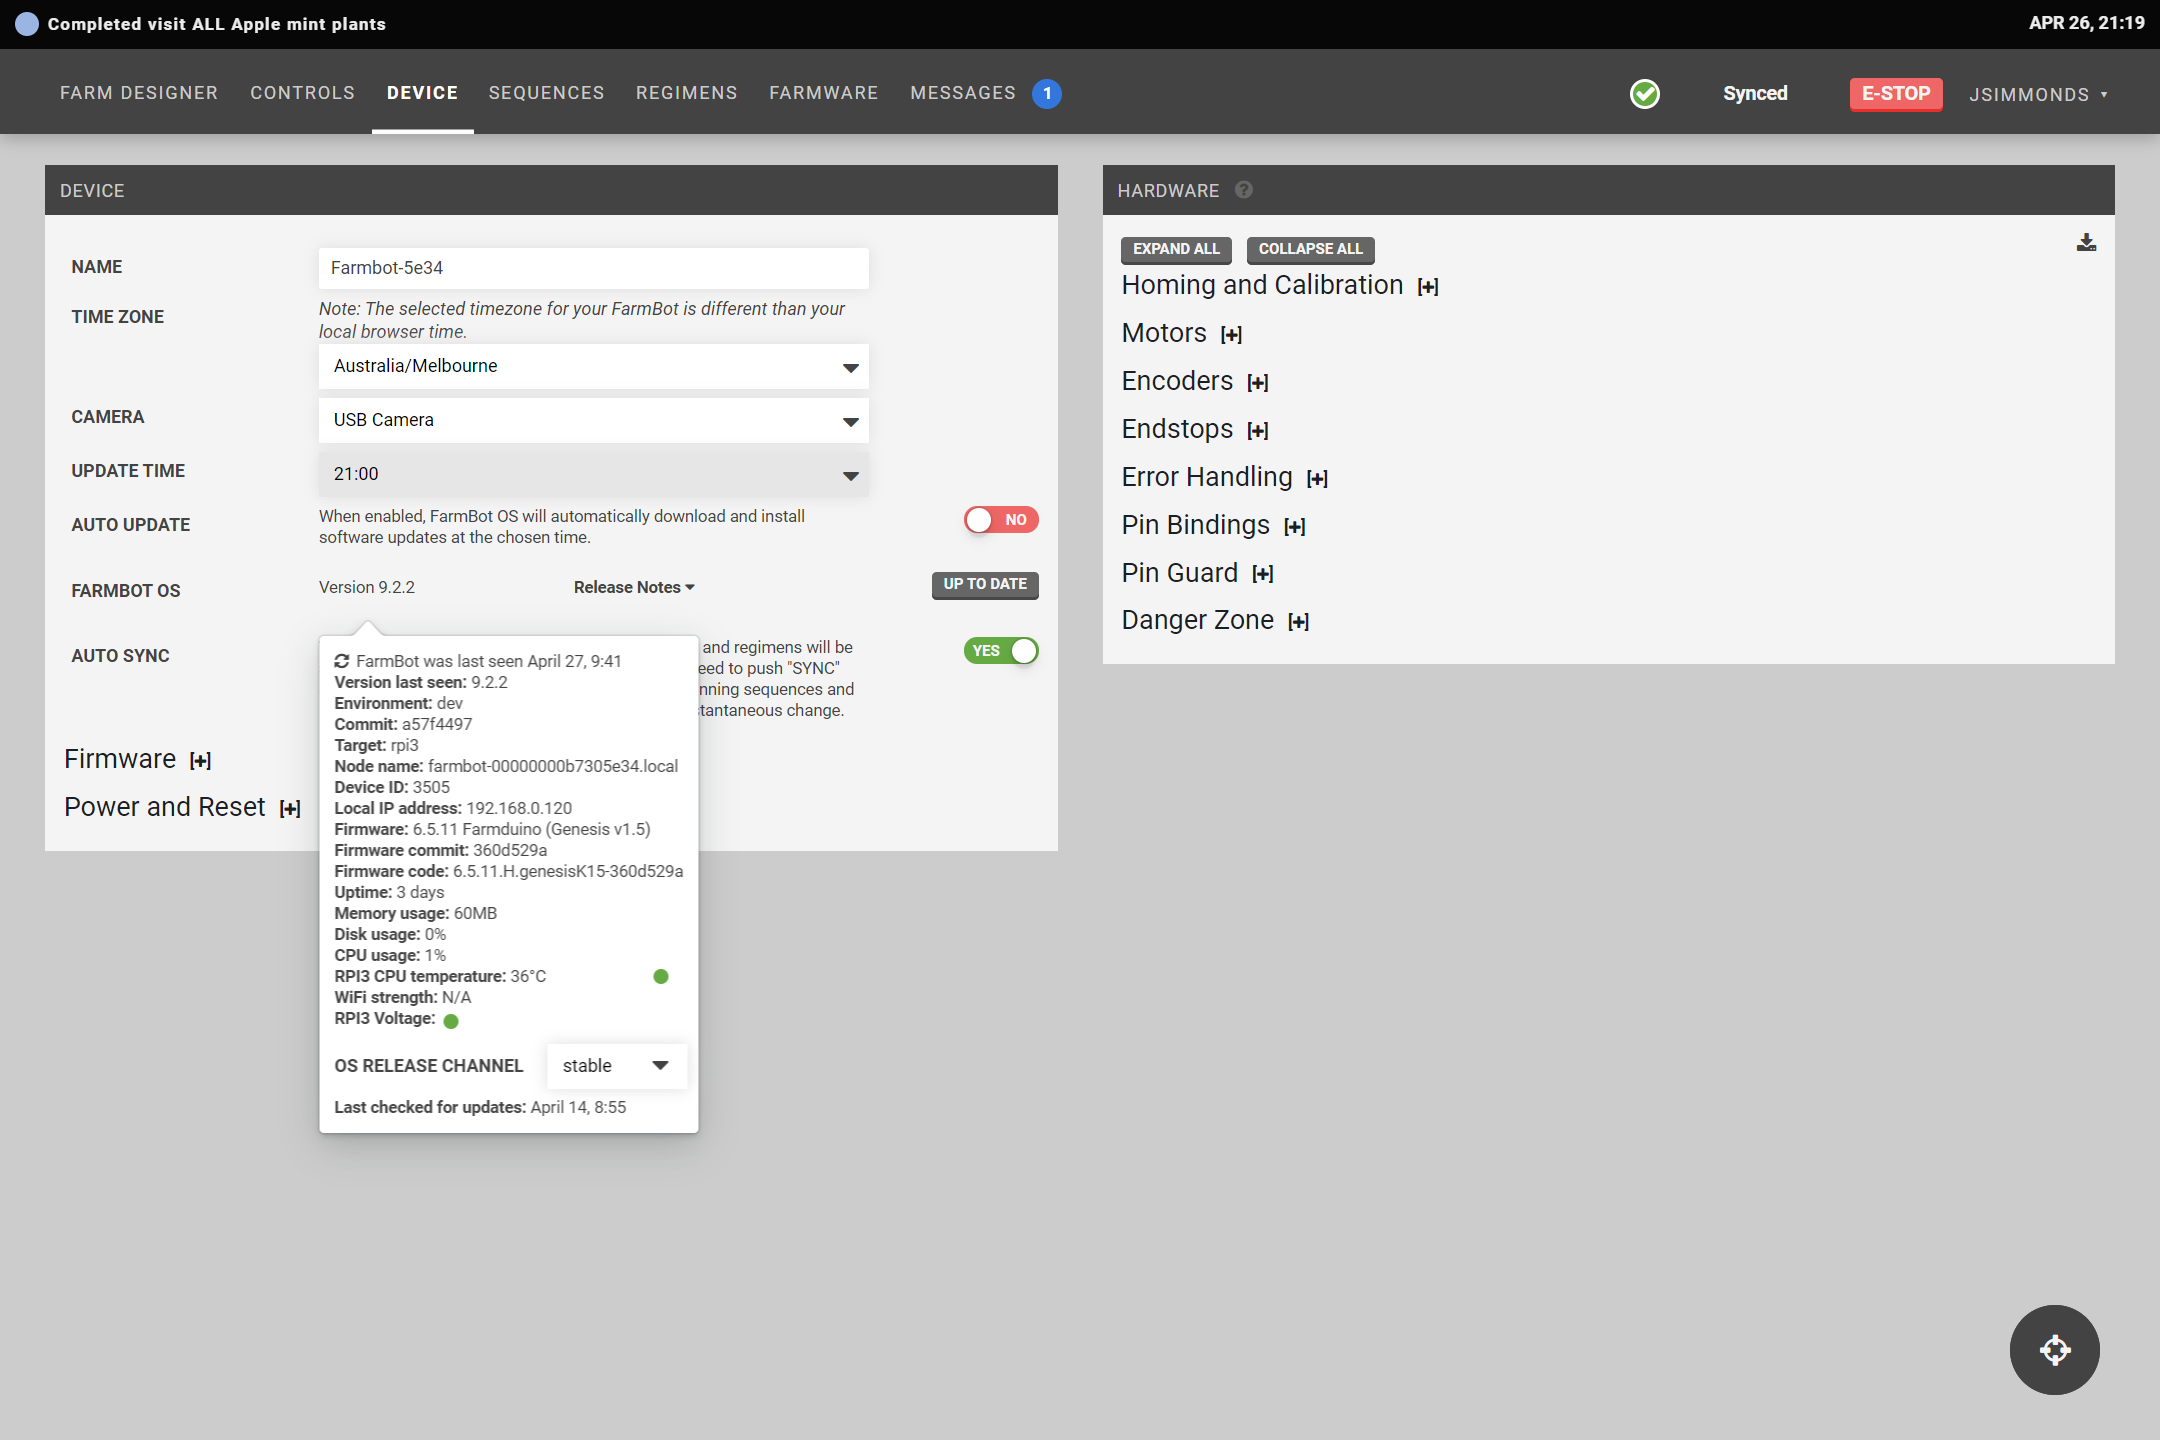
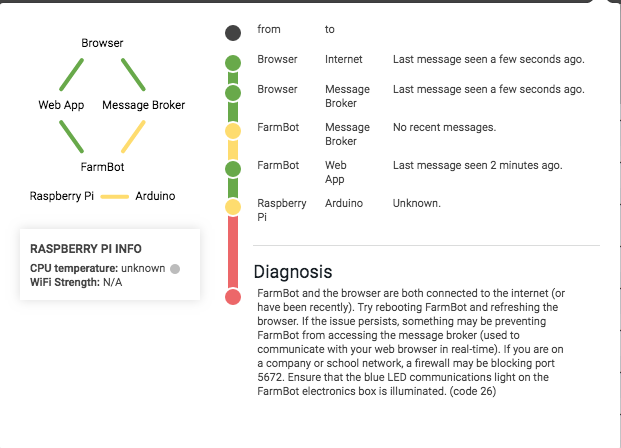
How can we get information about the rasperIP, logs over SSH or anything else to understand what’s happen ?
Could you look at my diag dump Report v0th4 ?
@vroyer Are you running any security software, proxies or firewalls? Particularly, is there anything on your network that blocks access to TCP port 5672?
No firewall, otherwise it would always block !
The issue only happen on quite long sequence, not on small sequence.
This makes me think there is a rate limitation or a congestion somewhere in the software.
Sending the MQTT status (13Kb) almost every second to the AMQP serveur (France to east-US), latency will never be guaranteed, leading to sequence failure. In your design, the farmbot cannot run without a good connection to the AMQP and Web server, and if network latency is too long, it fails without any way to restart properly, the farmbot does not keep any state locally (like the mounted tool or the sequence that was running…).
I guess that when the rasperIP memory is filled of sampled bot positions awaiting to be send, it crashes, there is a producer/consumer issue. You need a back-pressure mechanism to slow down the sequence when your buffer is full, or drop some messages…
Your device is unable to make DNS requests. Check that your dns server can resolve my.farm.bot and domains as listed in the document that Rick linked
Sorry, but still have an intermittent connection issue, not related to my local wifi network, but due to the internet network latency i guess.
Here is a video farmbot network issue video showing that MQTT ping fails sometimes, while pinging the farmbot from my laptop always succeed (You can notice that b8:27:eb:83:ea:91, starting with b8:27 is the farmbot MAC address, with DHCP IP 192.168.1.32).
First, I can i tune the MQTT ping timeout to workaround that ?
Second, do you really think a farmbot technology can afford continuously pinging a cloud server at more 10 000km far, is that really make sens ?
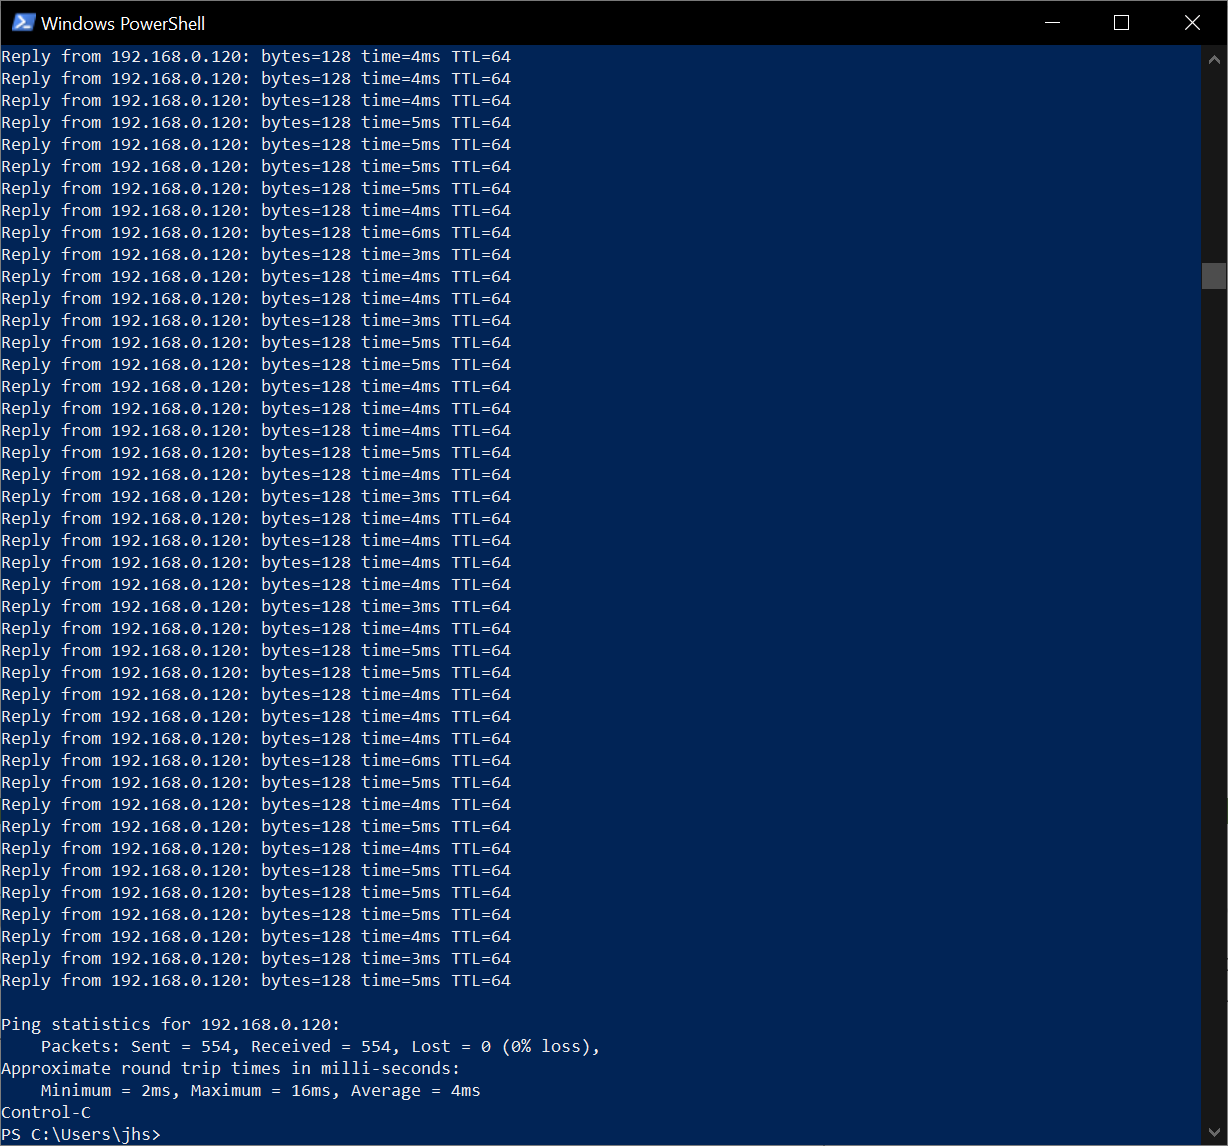
After pinging the farmbot all the day (laptop->farmbot), i observed something strange.
When a sequence is running, one ping packet is lost every 18 seconds, as shown below :
64 bytes from 192.168.1.32: icmp_seq=23414 ttl=64 time=12.152 ms
Request timeout for icmp_seq 23415
64 bytes from 192.168.1.32: icmp_seq=23416 ttl=64 time=125.110 ms
64 bytes from 192.168.1.32: icmp_seq=23417 ttl=64 time=247.884 ms
64 bytes from 192.168.1.32: icmp_seq=23418 ttl=64 time=591.572 ms
64 bytes from 192.168.1.32: icmp_seq=23419 ttl=64 time=294.823 ms
64 bytes from 192.168.1.32: icmp_seq=23420 ttl=64 time=349.721 ms
64 bytes from 192.168.1.32: icmp_seq=23421 ttl=64 time=383.428 ms
64 bytes from 192.168.1.32: icmp_seq=23422 ttl=64 time=8.263 ms
64 bytes from 192.168.1.32: icmp_seq=23423 ttl=64 time=12.829 ms
64 bytes from 192.168.1.32: icmp_seq=23424 ttl=64 time=6.000 ms
64 bytes from 192.168.1.32: icmp_seq=23425 ttl=64 time=20.440 ms
64 bytes from 192.168.1.32: icmp_seq=23426 ttl=64 time=134.749 ms
64 bytes from 192.168.1.32: icmp_seq=23427 ttl=64 time=6.158 ms
64 bytes from 192.168.1.32: icmp_seq=23428 ttl=64 time=5.994 ms
64 bytes from 192.168.1.32: icmp_seq=23429 ttl=64 time=10.244 ms
64 bytes from 192.168.1.32: icmp_seq=23430 ttl=64 time=6.379 ms
64 bytes from 192.168.1.32: icmp_seq=23431 ttl=64 time=16.644 ms
64 bytes from 192.168.1.32: icmp_seq=23432 ttl=64 time=60.269 ms
Request timeout for icmp_seq 23433
64 bytes from 192.168.1.32: icmp_seq=23434 ttl=64 time=24.584 ms
64 bytes from 192.168.1.32: icmp_seq=23435 ttl=64 time=40.448 ms
64 bytes from 192.168.1.32: icmp_seq=23436 ttl=64 time=31.651 ms
64 bytes from 192.168.1.32: icmp_seq=23437 ttl=64 time=59.254 ms
64 bytes from 192.168.1.32: icmp_seq=23438 ttl=64 time=99.993 ms
64 bytes from 192.168.1.32: icmp_seq=23439 ttl=64 time=156.979 ms
64 bytes from 192.168.1.32: icmp_seq=23440 ttl=64 time=182.796 ms
64 bytes from 192.168.1.32: icmp_seq=23441 ttl=64 time=225.795 ms
64 bytes from 192.168.1.32: icmp_seq=23442 ttl=64 time=7.525 ms
64 bytes from 192.168.1.32: icmp_seq=23443 ttl=64 time=8.663 ms
64 bytes from 192.168.1.32: icmp_seq=23444 ttl=64 time=5.752 ms
64 bytes from 192.168.1.32: icmp_seq=23445 ttl=64 time=10.133 ms
64 bytes from 192.168.1.32: icmp_seq=23446 ttl=64 time=12.987 ms
64 bytes from 192.168.1.32: icmp_seq=23447 ttl=64 time=6.362 ms
64 bytes from 192.168.1.32: icmp_seq=23448 ttl=64 time=6.707 ms
64 bytes from 192.168.1.32: icmp_seq=23449 ttl=64 time=6.888 ms
64 bytes from 192.168.1.32: icmp_seq=23450 ttl=64 time=3.424 ms
Request timeout for icmp_seq 23451
64 bytes from 192.168.1.32: icmp_seq=23452 ttl=64 time=38.714 ms
64 bytes from 192.168.1.32: icmp_seq=23453 ttl=64 time=88.908 ms
64 bytes from 192.168.1.32: icmp_seq=23454 ttl=64 time=71.027 ms
64 bytes from 192.168.1.32: icmp_seq=23455 ttl=64 time=95.582 ms
64 bytes from 192.168.1.32: icmp_seq=23456 ttl=64 time=137.119 ms
64 bytes from 192.168.1.32: icmp_seq=23457 ttl=64 time=175.670 ms
64 bytes from 192.168.1.32: icmp_seq=23458 ttl=64 time=219.777 ms
64 bytes from 192.168.1.32: icmp_seq=23459 ttl=64 time=7.380 ms
64 bytes from 192.168.1.32: icmp_seq=23460 ttl=64 time=6.170 ms
64 bytes from 192.168.1.32: icmp_seq=23461 ttl=64 time=6.468 ms
64 bytes from 192.168.1.32: icmp_seq=23462 ttl=64 time=5.118 ms
64 bytes from 192.168.1.32: icmp_seq=23463 ttl=64 time=5.676 ms
64 bytes from 192.168.1.32: icmp_seq=23464 ttl=64 time=67.499 ms
64 bytes from 192.168.1.32: icmp_seq=23465 ttl=64 time=6.168 ms
64 bytes from 192.168.1.32: icmp_seq=23466 ttl=64 time=12.207 ms
64 bytes from 192.168.1.32: icmp_seq=23467 ttl=64 time=3.208 ms
64 bytes from 192.168.1.32: icmp_seq=23468 ttl=64 time=23.361 ms
Request timeout for icmp_seq 23469
64 bytes from 192.168.1.32: icmp_seq=23470 ttl=64 time=13.762 ms
64 bytes from 192.168.1.32: icmp_seq=23471 ttl=64 time=33.680 ms
64 bytes from 192.168.1.32: icmp_seq=23472 ttl=64 time=27.881 ms
64 bytes from 192.168.1.32: icmp_seq=23473 ttl=64 time=53.955 ms
64 bytes from 192.168.1.32: icmp_seq=23474 ttl=64 time=94.302 ms
64 bytes from 192.168.1.32: icmp_seq=23475 ttl=64 time=151.225 ms
64 bytes from 192.168.1.32: icmp_seq=23476 ttl=64 time=175.916 ms
64 bytes from 192.168.1.32: icmp_seq=23477 ttl=64 time=222.389 ms
64 bytes from 192.168.1.32: icmp_seq=23478 ttl=64 time=5.991 ms
64 bytes from 192.168.1.32: icmp_seq=23479 ttl=64 time=5.663 ms
64 bytes from 192.168.1.32: icmp_seq=23480 ttl=64 time=188.074 ms
64 bytes from 192.168.1.32: icmp_seq=23481 ttl=64 time=231.155 ms
64 bytes from 192.168.1.32: icmp_seq=23482 ttl=64 time=206.552 ms
64 bytes from 192.168.1.32: icmp_seq=23483 ttl=64 time=5.952 ms
64 bytes from 192.168.1.32: icmp_seq=23484 ttl=64 time=5.717 ms
64 bytes from 192.168.1.32: icmp_seq=23485 ttl=64 time=5.553 ms
64 bytes from 192.168.1.32: icmp_seq=23486 ttl=64 time=11.974 ms
Request timeout for icmp_seq 23487
64 bytes from 192.168.1.32: icmp_seq=23488 ttl=64 time=25.418 ms
64 bytes from 192.168.1.32: icmp_seq=23489 ttl=64 time=66.935 ms
64 bytes from 192.168.1.32: icmp_seq=23490 ttl=64 time=52.565 ms
64 bytes from 192.168.1.32: icmp_seq=23491 ttl=64 time=83.331 ms
64 bytes from 192.168.1.32: icmp_seq=23492 ttl=64 time=118.284 ms
64 bytes from 192.168.1.32: icmp_seq=23493 ttl=64 time=174.316 ms
64 bytes from 192.168.1.32: icmp_seq=23494 ttl=64 time=209.774 ms
64 bytes from 192.168.1.32: icmp_seq=23495 ttl=64 time=5.809 ms
64 bytes from 192.168.1.32: icmp_seq=23496 ttl=64 time=6.801 ms
64 bytes from 192.168.1.32: icmp_seq=23497 ttl=64 time=6.225 ms
64 bytes from 192.168.1.32: icmp_seq=23498 ttl=64 time=2.766 ms
64 bytes from 192.168.1.32: icmp_seq=23499 ttl=64 time=9.210 ms
64 bytes from 192.168.1.32: icmp_seq=23500 ttl=64 time=6.412 ms
64 bytes from 192.168.1.32: icmp_seq=23501 ttl=64 time=8.372 ms
64 bytes from 192.168.1.32: icmp_seq=23502 ttl=64 time=6.672 ms
64 bytes from 192.168.1.32: icmp_seq=23503 ttl=64 time=7.380 ms
64 bytes from 192.168.1.32: icmp_seq=23504 ttl=64 time=6.340 ms
Request timeout for icmp_seq 23505
64 bytes from 192.168.1.32: icmp_seq=23506 ttl=64 time=53.756 ms
64 bytes from 192.168.1.32: icmp_seq=23507 ttl=64 time=100.615 ms
64 bytes from 192.168.1.32: icmp_seq=23508 ttl=64 time=92.311 ms
64 bytes from 192.168.1.32: icmp_seq=23509 ttl=64 time=115.753 ms
64 bytes from 192.168.1.32: icmp_seq=23510 ttl=64 time=158.558 ms
64 bytes from 192.168.1.32: icmp_seq=23511 ttl=64 time=215.557 ms
64 bytes from 192.168.1.32: icmp_seq=23512 ttl=64 time=4.064 ms
64 bytes from 192.168.1.32: icmp_seq=23513 ttl=64 time=3.789 ms
64 bytes from 192.168.1.32: icmp_seq=23514 ttl=64 time=5.687 ms
64 bytes from 192.168.1.32: icmp_seq=23515 ttl=64 time=19.795 ms
64 bytes from 192.168.1.32: icmp_seq=23516 ttl=64 time=6.730 ms
64 bytes from 192.168.1.32: icmp_seq=23517 ttl=64 time=26.352 ms
64 bytes from 192.168.1.32: icmp_seq=23518 ttl=64 time=2.923 ms
64 bytes from 192.168.1.32: icmp_seq=23519 ttl=64 time=2.929 ms
64 bytes from 192.168.1.32: icmp_seq=23520 ttl=64 time=14.268 ms
64 bytes from 192.168.1.32: icmp_seq=23521 ttl=64 time=2.703 ms
64 bytes from 192.168.1.32: icmp_seq=23522 ttl=64 time=16.085 ms
Request timeout for icmp_seq 23523
64 bytes from 192.168.1.32: icmp_seq=23524 ttl=64 time=14.345 ms
64 bytes from 192.168.1.32: icmp_seq=23525 ttl=64 time=37.805 ms
64 bytes from 192.168.1.32: icmp_seq=23526 ttl=64 time=23.513 ms
64 bytes from 192.168.1.32: icmp_seq=23527 ttl=64 time=58.884 ms
64 bytes from 192.168.1.32: icmp_seq=23528 ttl=64 time=106.523 ms
64 bytes from 192.168.1.32: icmp_seq=23529 ttl=64 time=147.857 ms
64 bytes from 192.168.1.32: icmp_seq=23530 ttl=64 time=196.464 ms
64 bytes from 192.168.1.32: icmp_seq=23531 ttl=64 time=233.077 ms
64 bytes from 192.168.1.32: icmp_seq=23532 ttl=64 time=3.212 ms
64 bytes from 192.168.1.32: icmp_seq=23533 ttl=64 time=15.742 ms
64 bytes from 192.168.1.32: icmp_seq=23534 ttl=64 time=5.402 ms
64 bytes from 192.168.1.32: icmp_seq=23535 ttl=64 time=8.307 ms
64 bytes from 192.168.1.32: icmp_seq=23536 ttl=64 time=12.972 ms
64 bytes from 192.168.1.32: icmp_seq=23537 ttl=64 time=6.448 ms
64 bytes from 192.168.1.32: icmp_seq=23538 ttl=64 time=5.576 ms
64 bytes from 192.168.1.32: icmp_seq=23539 ttl=64 time=5.619 ms
64 bytes from 192.168.1.32: icmp_seq=23540 ttl=64 time=6.327 ms
Request timeout for icmp_seq 23541
64 bytes from 192.168.1.32: icmp_seq=23542 ttl=64 time=21.733 ms
@vroyer, do you have a theorie ? I tried to reproduce your observation but
Here are my PC to FBOS pings while I ran a 40s Sequence
I just ran a long sequence taking pictures of the bed.
Today, i still loose some ping, bu not always every 18s (see trace).
But a MQTT ping over TCP should succeed even when loosing a packet every 18s, TCP has flow control and retry to deal with that.
When taking pictures, pictures are available before the bot moves to the position where the picture was taken meaning that uploading a picture is faster than sending the bot position through MQTT, probably because Google Cloud Storage is faster than your MQTT heroku gateway (i mean the server or the network).
Moreover, the bot seems to have connexion issue until all accumulated bot positions are not sent to the MQTT gateway, and when the bot queue is full or plant status update timeout, the sequence fails. This is a basic flow control issue in your design, there is no back pressure to slow down the sequence until the sequence fails. Of course, this does not happens in your labs with a good latency to your MQTT gateway, but i’m in France, and of course, and internet latency is far longer than in US.
There is only 2 ways to design it properly.
A - the sequence can work off line, and asynchronously upload positions and other data. That means buffering data in the farmbot.
B - the sequence works online, and wait data to be uploaded to do the next step.
It seems you designed something with a limited queue of data to upload on the bot, and no back pressure to slow down the running sequence. As the result, if a sequence produce more data than the network can upload, after a while, the queue is full and the sequence fails. Of course, in your labs, this phenomena does not happen, but from France, it happens, and this is very frustrating to get a farmbot that does not work because such of basic design flaw. Please consider this explanation to improve your bot, with a customisable MQTT timeout, and introduce a new sequence command like “wait until queue is empty” that could be used to slow down the sequence execution in such situation…
64 bytes from 192.168.1.32: icmp_seq=224 ttl=64 time=2.635 ms
64 bytes from 192.168.1.32: icmp_seq=225 ttl=64 time=42.232 ms
64 bytes from 192.168.1.32: icmp_seq=226 ttl=64 time=46.045 ms
64 bytes from 192.168.1.32: icmp_seq=227 ttl=64 time=3.913 ms
64 bytes from 192.168.1.32: icmp_seq=228 ttl=64 time=2.981 ms
64 bytes from 192.168.1.32: icmp_seq=229 ttl=64 time=2.476 ms
64 bytes from 192.168.1.32: icmp_seq=230 ttl=64 time=6.238 ms
64 bytes from 192.168.1.32: icmp_seq=231 ttl=64 time=5.566 ms
64 bytes from 192.168.1.32: icmp_seq=232 ttl=64 time=86.654 ms
64 bytes from 192.168.1.32: icmp_seq=233 ttl=64 time=2.324 ms
64 bytes from 192.168.1.32: icmp_seq=234 ttl=64 time=5.772 ms
Request timeout for icmp_seq 235
64 bytes from 192.168.1.32: icmp_seq=236 ttl=64 time=8.503 ms
64 bytes from 192.168.1.32: icmp_seq=237 ttl=64 time=6.262 ms
64 bytes from 192.168.1.32: icmp_seq=238 ttl=64 time=43.793 ms
64 bytes from 192.168.1.32: icmp_seq=239 ttl=64 time=23.265 ms
64 bytes from 192.168.1.32: icmp_seq=240 ttl=64 time=315.803 ms
64 bytes from 192.168.1.32: icmp_seq=241 ttl=64 time=3.028 ms
64 bytes from 192.168.1.32: icmp_seq=242 ttl=64 time=4.383 ms
64 bytes from 192.168.1.32: icmp_seq=243 ttl=64 time=2.328 ms
64 bytes from 192.168.1.32: icmp_seq=244 ttl=64 time=2.938 ms
64 bytes from 192.168.1.32: icmp_seq=245 ttl=64 time=6.837 ms
64 bytes from 192.168.1.32: icmp_seq=246 ttl=64 time=106.957 ms
64 bytes from 192.168.1.32: icmp_seq=247 ttl=64 time=3.792 ms
Request timeout for icmp_seq 248
64 bytes from 192.168.1.32: icmp_seq=249 ttl=64 time=63.010 ms
64 bytes from 192.168.1.32: icmp_seq=250 ttl=64 time=255.016 ms
64 bytes from 192.168.1.32: icmp_seq=251 ttl=64 time=339.240 ms
64 bytes from 192.168.1.32: icmp_seq=252 ttl=64 time=3.556 ms
64 bytes from 192.168.1.32: icmp_seq=253 ttl=64 time=2.554 ms
64 bytes from 192.168.1.32: icmp_seq=254 ttl=64 time=2.520 ms
64 bytes from 192.168.1.32: icmp_seq=255 ttl=64 time=151.783 ms
64 bytes from 192.168.1.32: icmp_seq=256 ttl=64 time=687.512 ms
64 bytes from 192.168.1.32: icmp_seq=257 ttl=64 time=31.304 ms
64 bytes from 192.168.1.32: icmp_seq=258 ttl=64 time=16.051 ms
64 bytes from 192.168.1.32: icmp_seq=259 ttl=64 time=9.169 ms
Request timeout for icmp_seq 260
64 bytes from 192.168.1.32: icmp_seq=261 ttl=64 time=27.119 ms
64 bytes from 192.168.1.32: icmp_seq=262 ttl=64 time=19.159 ms
64 bytes from 192.168.1.32: icmp_seq=263 ttl=64 time=6.111 ms
64 bytes from 192.168.1.32: icmp_seq=264 ttl=64 time=9.765 ms
64 bytes from 192.168.1.32: icmp_seq=265 ttl=64 time=926.713 ms
64 bytes from 192.168.1.32: icmp_seq=266 ttl=64 time=9.777 ms
64 bytes from 192.168.1.32: icmp_seq=267 ttl=64 time=6.542 ms
64 bytes from 192.168.1.32: icmp_seq=268 ttl=64 time=4.574 ms
64 bytes from 192.168.1.32: icmp_seq=269 ttl=64 time=3.793 ms
64 bytes from 192.168.1.32: icmp_seq=270 ttl=64 time=14.032 ms
64 bytes from 192.168.1.32: icmp_seq=271 ttl=64 time=3.203 ms
64 bytes from 192.168.1.32: icmp_seq=272 ttl=64 time=3.407 ms
64 bytes from 192.168.1.32: icmp_seq=273 ttl=64 time=3.169 ms
64 bytes from 192.168.1.32: icmp_seq=274 ttl=64 time=3.098 ms
64 bytes from 192.168.1.32: icmp_seq=275 ttl=64 time=5.607 ms
Request timeout for icmp_seq 276
64 bytes from 192.168.1.32: icmp_seq=277 ttl=64 time=7.401 ms
64 bytes from 192.168.1.32: icmp_seq=278 ttl=64 time=11.029 ms
64 bytes from 192.168.1.32: icmp_seq=279 ttl=64 time=4.222 ms
64 bytes from 192.168.1.32: icmp_seq=280 ttl=64 time=10.268 ms
64 bytes from 192.168.1.32: icmp_seq=281 ttl=64 time=17.182 ms
64 bytes from 192.168.1.32: icmp_seq=282 ttl=64 time=9.815 ms
64 bytes from 192.168.1.32: icmp_seq=283 ttl=64 time=9.102 ms
64 bytes from 192.168.1.32: icmp_seq=284 ttl=64 time=165.902 ms
64 bytes from 192.168.1.32: icmp_seq=285 ttl=64 time=3.680 ms
64 bytes from 192.168.1.32: icmp_seq=286 ttl=64 time=12.883 ms
64 bytes from 192.168.1.32: icmp_seq=287 ttl=64 time=7.640 ms
64 bytes from 192.168.1.32: icmp_seq=288 ttl=64 time=11.075 ms
64 bytes from 192.168.1.32: icmp_seq=289 ttl=64 time=3.650 ms
64 bytes from 192.168.1.32: icmp_seq=290 ttl=64 time=9.800 ms
64 bytes from 192.168.1.32: icmp_seq=291 ttl=64 time=6.388 ms
64 bytes from 192.168.1.32: icmp_seq=292 ttl=64 time=9.398 ms
64 bytes from 192.168.1.32: icmp_seq=293 ttl=64 time=15.544 ms
64 bytes from 192.168.1.32: icmp_seq=294 ttl=64 time=10.502 ms
True, but my.farm.bot WebApp seems to apply a strict wall-clock timeout on MQTT Pongs, regardless of where Amazon’s edge servers live ( I’m ~ 14,400 km from us-east-1 ! but get good response )
You know this updated document about backend network details ?
I’m curious to try to replicate your issue and discover the ( assumed ) lack of backpressure flow control along the MQTT/AMQP data channel.
Not sure what you mean . . The logs picture you show from the WebApp is just a filtered and transformed version of the FBOS raw logging which you can see by either SSH into the RPi or use Erlang Distribution to “remsh” into IEx on the RPi. From the IEx prompt you use RingLogger commands to see the log text.
Ouch ! Not pretty. Have you checked the “CPU usage” number while your Sequence executes ?
(see below)
[edit 0]
You can get raw FBOS logs without using SSH or Erlang remsh . . the farmbot-js RPC client package will emit ‘logs’ events. If you’re happy with a little CoffeeScript, you could try a little program like this ![]()
global.atob = require 'atob'
util        = require 'util'
{ Farmbot } = require 'farmbot'

bot = new Farmbot {token: "eXAiyJ ( redacted )"}

bot.on 'logs', (data, eventName) ->
  util.log "#{util.inspect data.message}"

bot
  .connect()
  .then ->
    bot.execSequence 30677
  .then ->
    bot.execSequence 28377
  .finally ->
    util.log 'done -'
#    bot.client.end()