Hello FarmBot community,
Today we have a big update to share with you all. Let’s get started:
Curves
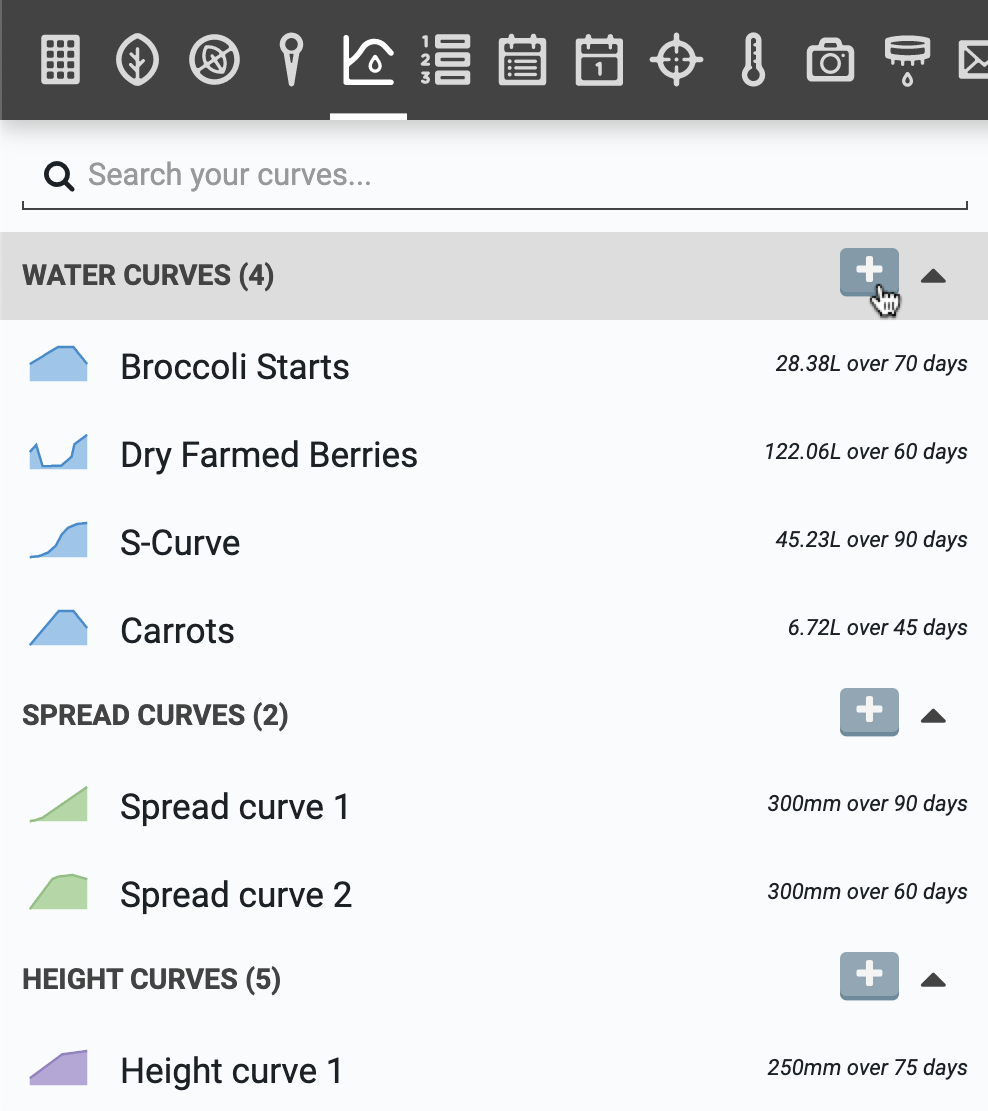
You’ll now find a new panel in the web app for creating and managing curves. Curves are plots of data that define how a property such as a plant’s water needs change over time. The app currently supports three curve types:
| Description | Units | |
|---|---|---|
|
|
How much water a plant should receive each day | Milliliters (mL) |
|
|
Expected diameter of a plant as it grows | Millimeters (mm) |
|
|
Expected height of a plant as it grows | Millimeters (mm) |
Creating a curve
To create a new curve, click the button for the curve type you wish to add.
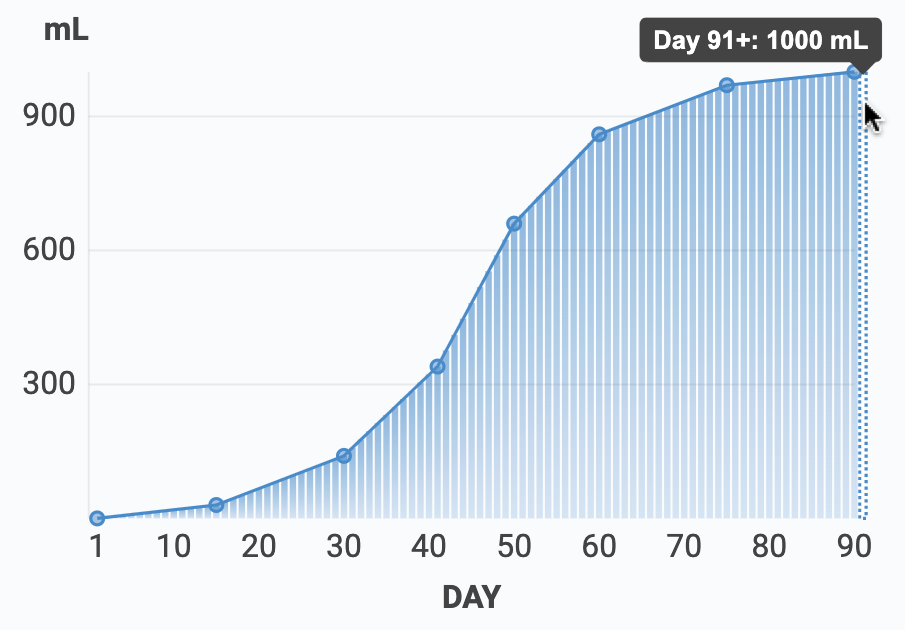
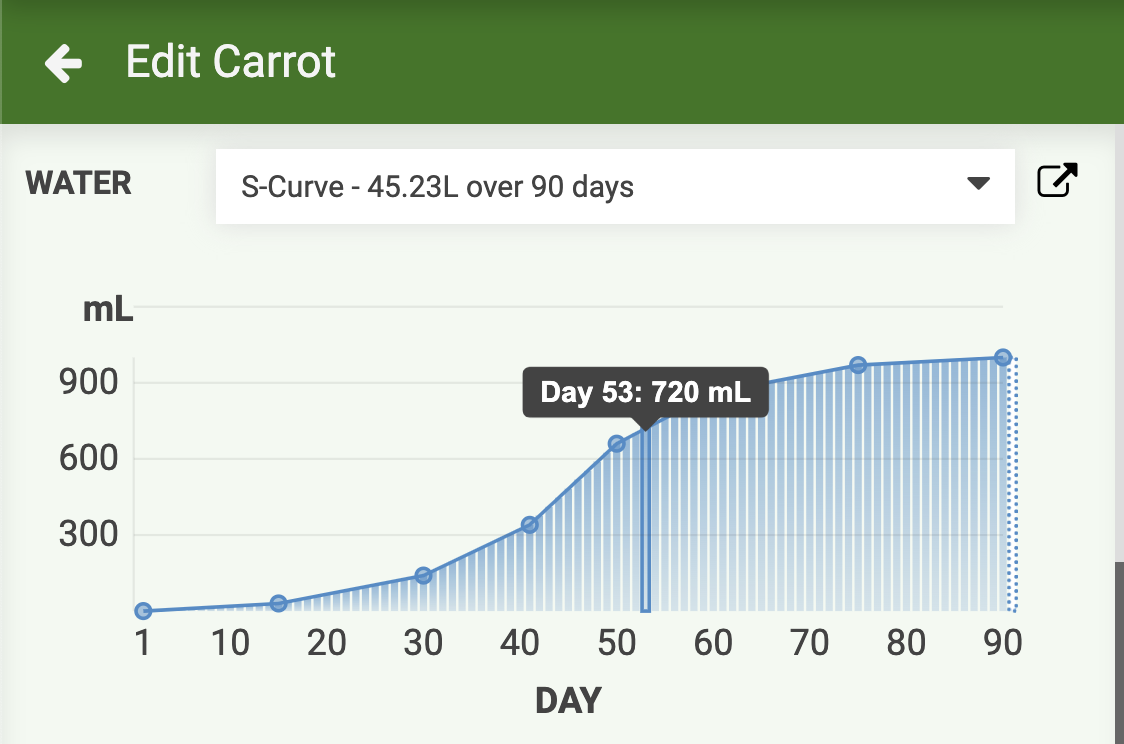
This will open up the edit curve panel where you can edit the curve’s name and overall shape, length, and magnitude using up to 10 control points. Control points are days with an explicitly defined value such as Day 30: 140mL.
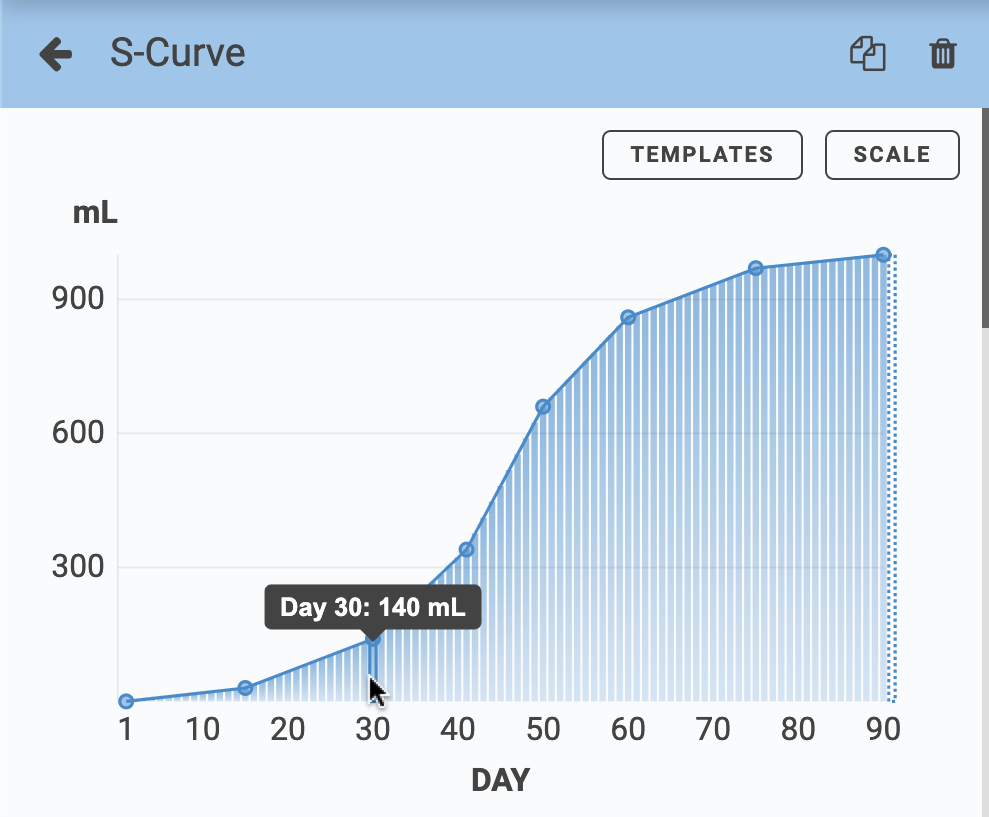
Curve values for days in-between control points are automatically interpolated using straight lines. The final control point will determine the value of the curve for all subsequent days, for example Day 91+: 1000mL.
Templates
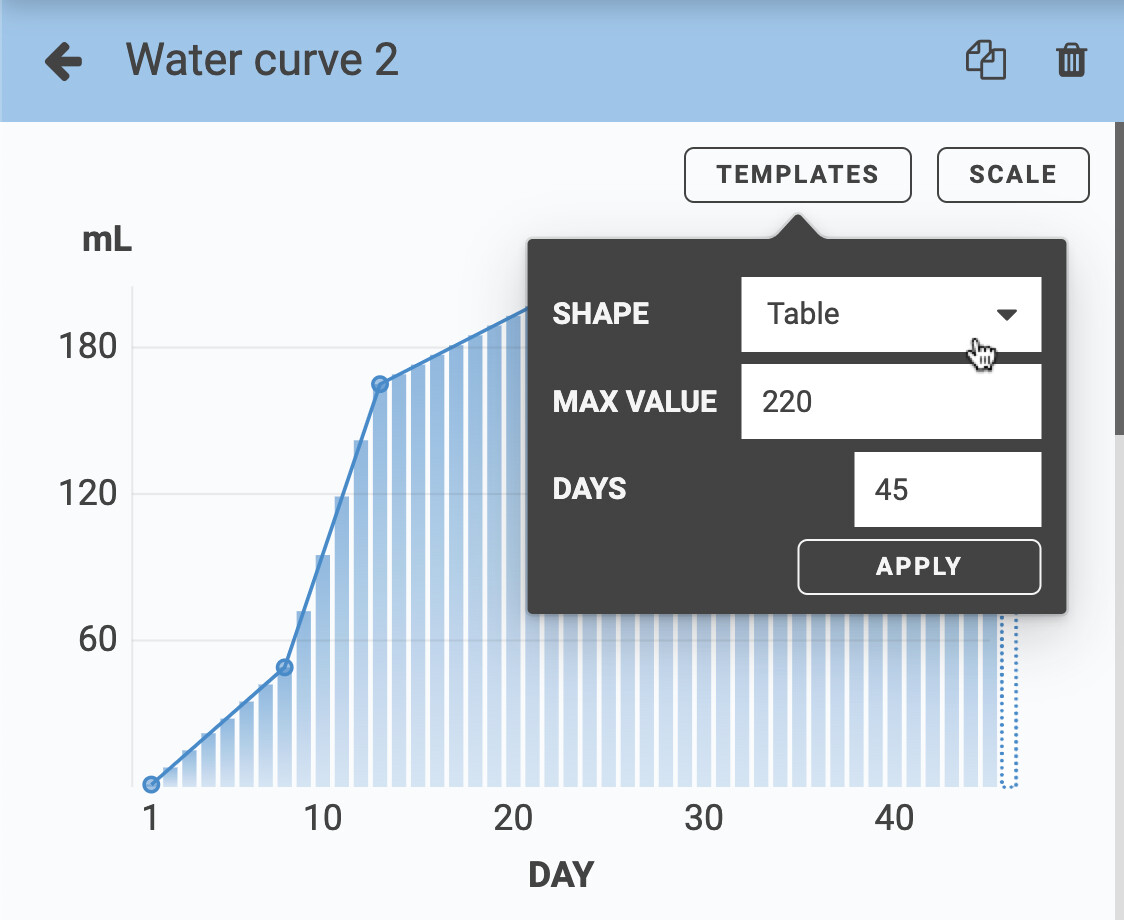
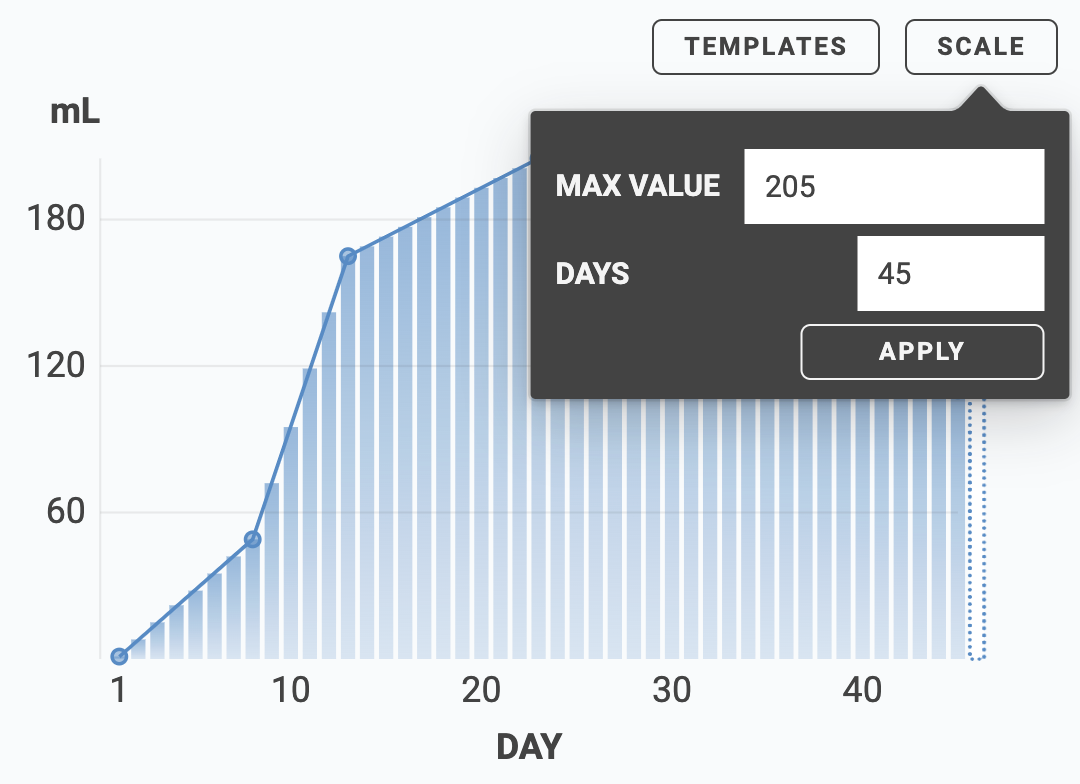
When editing a new curve, open up the TEMPLATES popup and select the SHAPE that most closely matches your desired curve. Options include Linear Ramp, Table, S-Curve, and Constant Value. You’ll also need to define the MAX VALUE and the length of the curve in DAYS.
Editing control points
After starting from a template, add additional control points by hovering over the curve line and clicking the button. Edit the value of a control point by dragging it up or down.
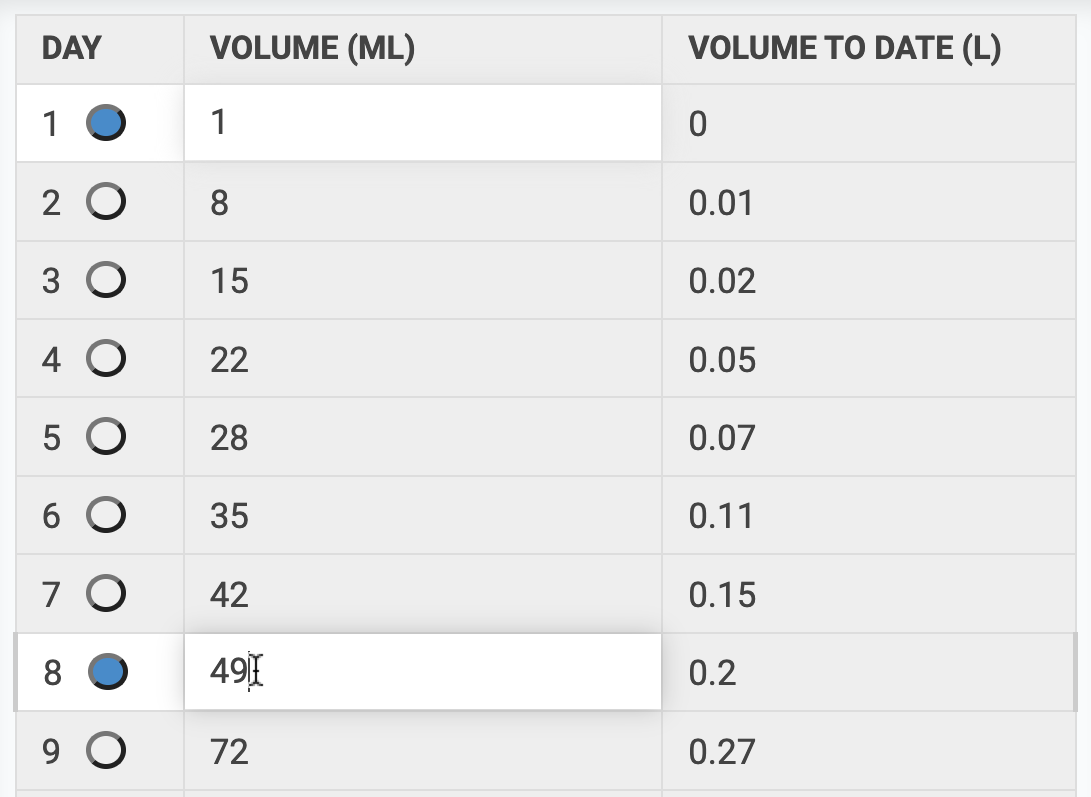
You may also add, edit, and remove control points using the table at the bottom of the panel. Add and remove control points by clicking the ![]() icons and edit the values using the corresponding table cells.
icons and edit the values using the corresponding table cells.
Scaling
If you need to adjust the length or magnitude of the curve while preserving the overall shape, open up the SCALE popup and enter a new MAX VALUE and DAYS for the curve. The control points and interpolated values will be automatically adjusted to best-fit the original curve within the new size constraints.
Using curves
Once you’ve created curves, you can apply them to any of your plants. To do so, open up the plant details panel and select the curves you wish to use with that plant. You may also apply the same curve to multiple plants from the multi-select panel.
When adding new plants to your garden, the most-frequently used curves for that crop will be automatically selected and applied, which you may override if desired.
You can then utilize the curve data from within a Lua sequence command using the new get_curve(id) function available in FarmBot OS v15.4.0. Curve IDs can be retrieved from the water_curve_id, spread_curve_id, or height_curve_id attributes of a plant (point) object. The curve ID can be used to get a curve object, which can then be used to get the curve value for a given day, usually based on the plant’s current age.
-- Get plant object from variable
local plant = variable("Plant")

if plant.water_curve_id then
    -- Get water curve object
    local water_curve = get_curve(plant.water_curve_id)
    -- Get water amount in mL for the plant's current age
    local water_ml = water_curve.day(plant.age)
    -- Display message about how much to water the plant today
    local days_old = " (" .. plant.age .. " days old)"
    toast(plant.name .. days_old .. " should be watered " .. water_ml .. "mL", "success")
else
    toast("Plant has no assigned water curve.", "warn")
end
In an upcoming announcement we’ll have some additional Lua helper functions and featured sequences that you can use for watering your crops based on their water curves.
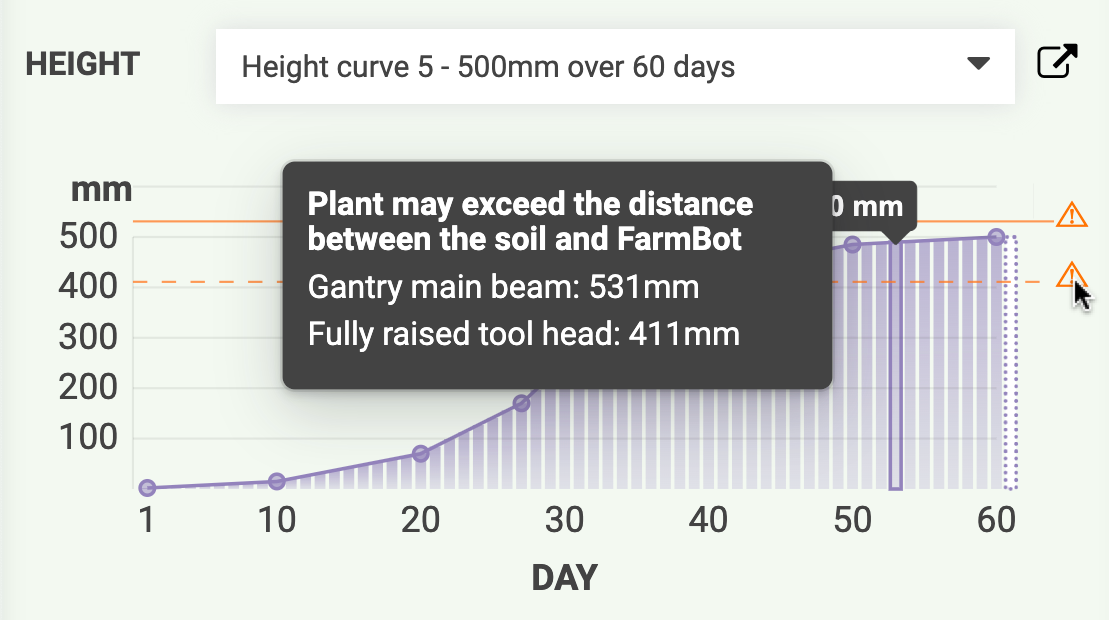
Curve warnings
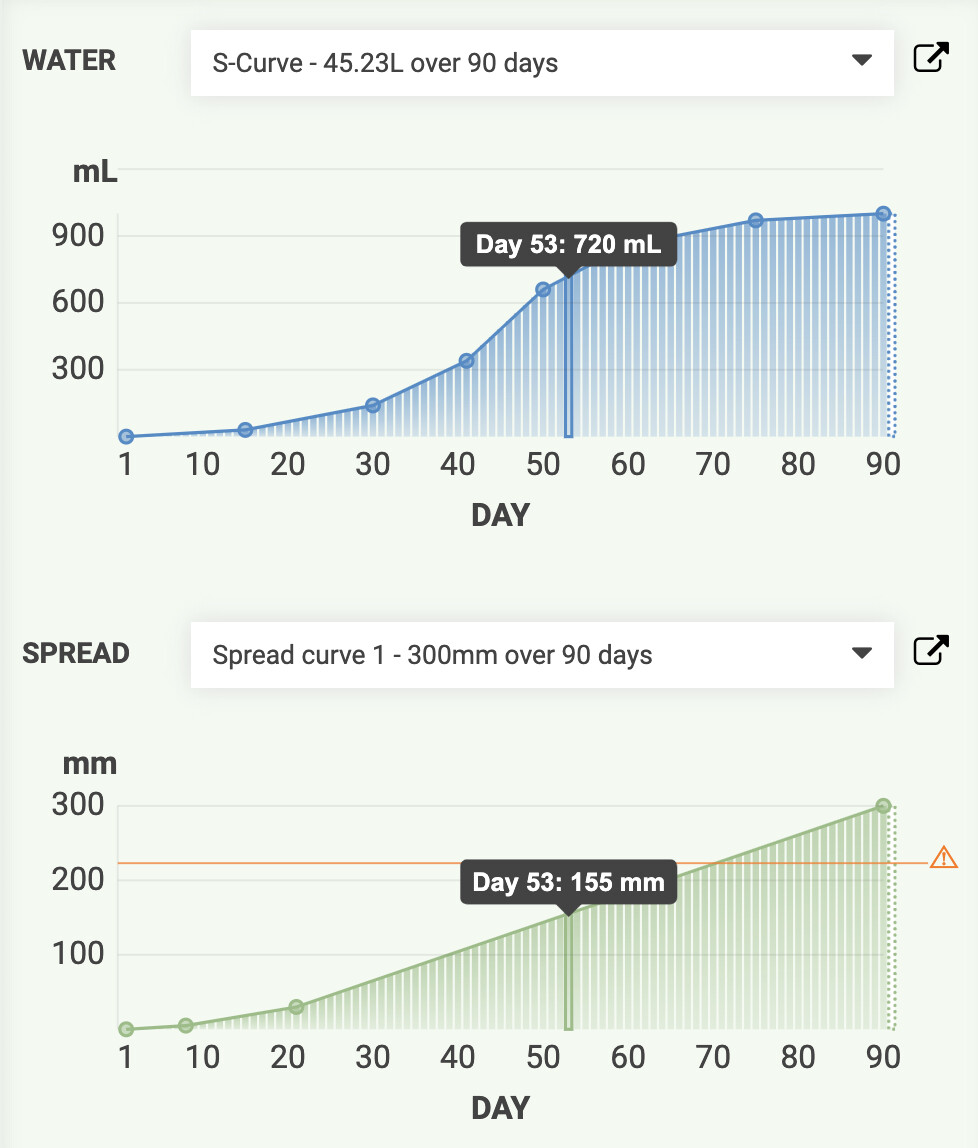
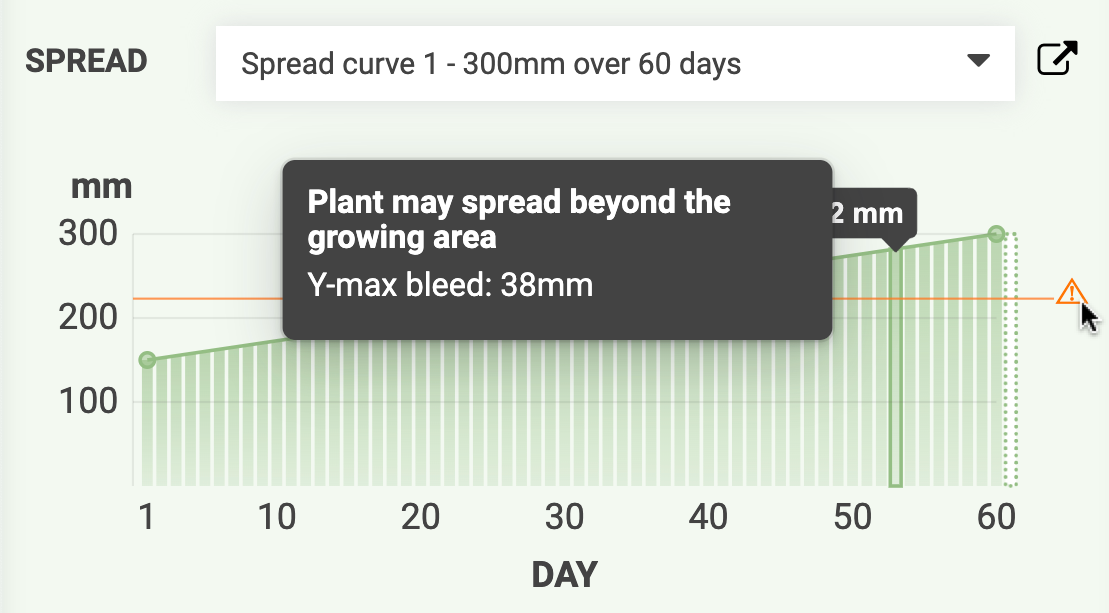
Based on the selected spread curve and the plant’s location in your garden bed, you may see warning lines on the spread curve plot indicating when the plant may bleed over the edge of the raised bed. Hovering over the plot will show a visualization of the plant’s spread in the map so that you may make adjustments to the plant’s location if needed.
Based on the selected height curve and the height of your FarmBot’s gantry above the soil, you may see warning lines on the height curve plot indicating that the plant may grow tall enough to interfere with the gantry or the tool head.