Sporadically DB Errors

Hello everyone,

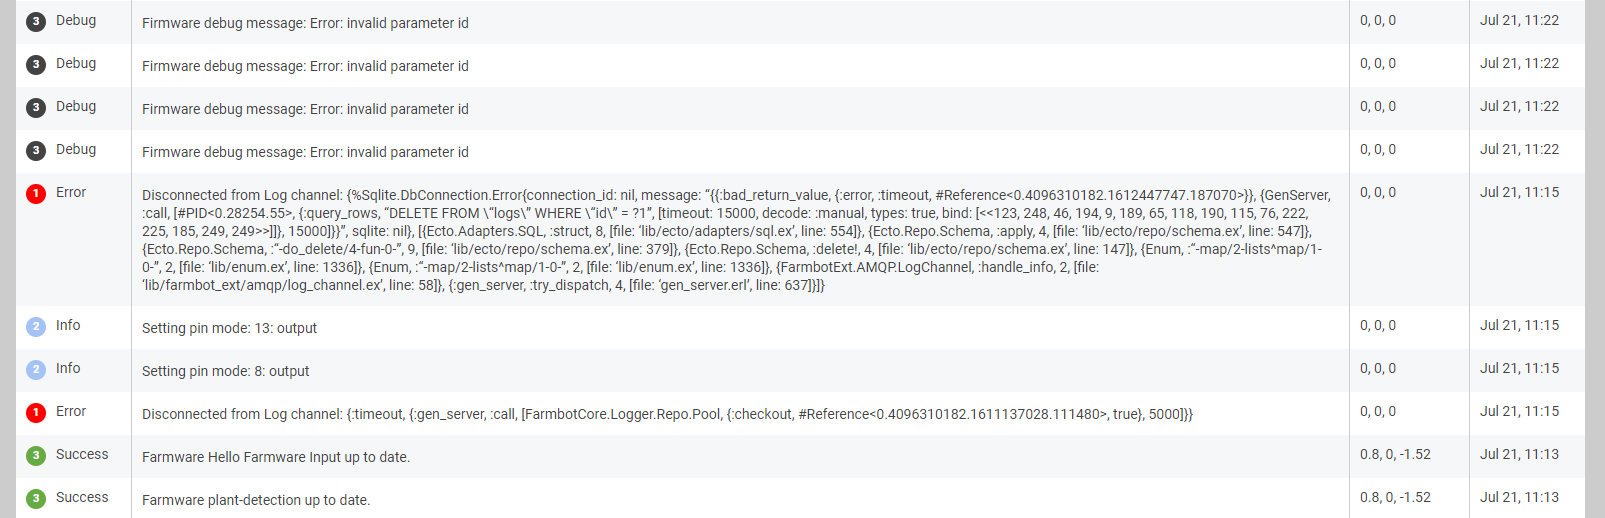
did anyone else see similar errors coming up recently? This one comes up a few times each day, but I wasn’t able to find out what causes this. Maybe something went wrong with my account @RickCarlino ?

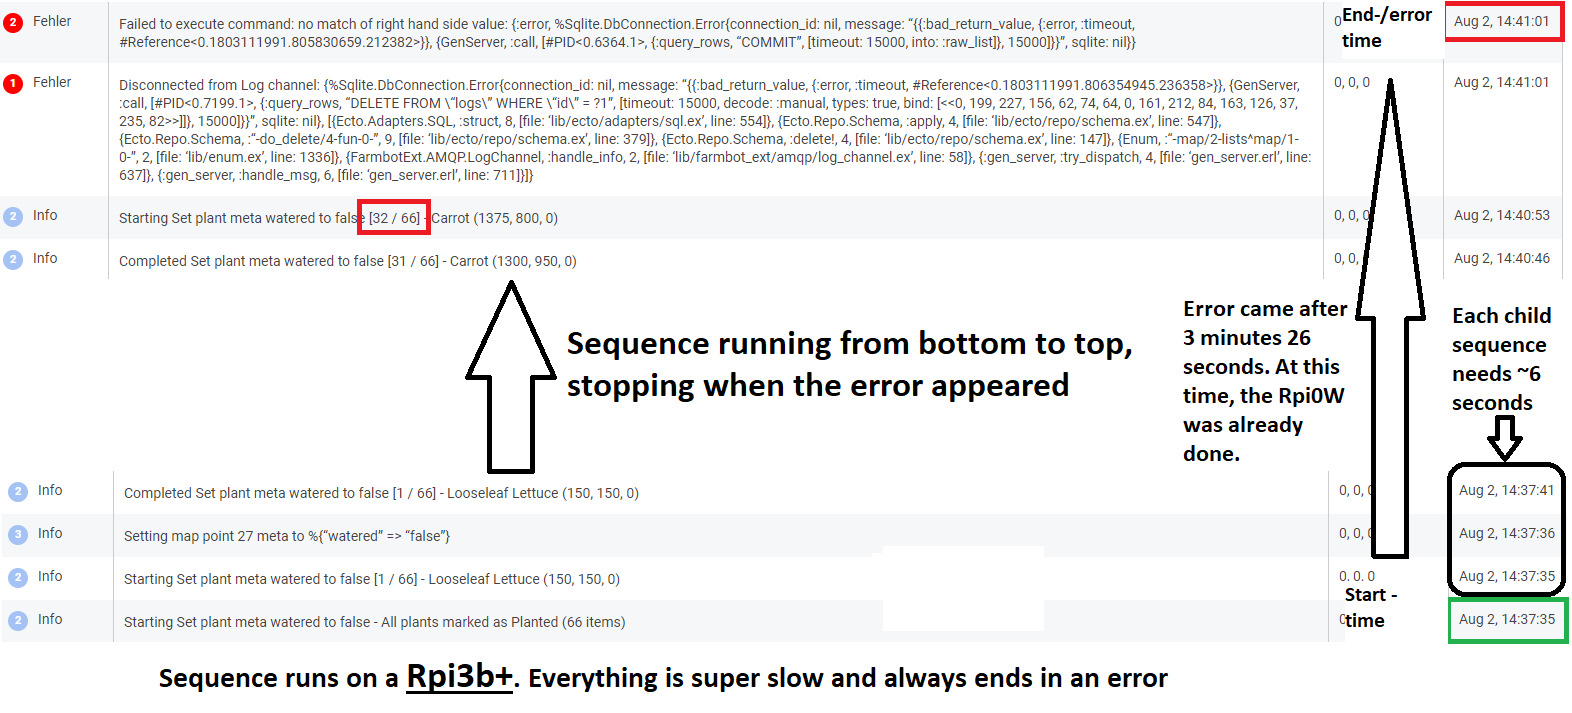
Disconnected from Log channel: {%Sqlite.DbConnection.Error{connection_id: nil, message: “{{:bad_return_value, {:error, :timeout, #Reference<0.4096310182.1612447747.187070>}}, {GenServer, :call, [#PID<0.28254.55>, {:query_rows, “DELETE FROM \“logs\” WHERE \“id\” = ?1”, [timeout: 15000, decode: :manual, types: true, bind: [<<123, 248, 46, 194, 9, 189, 65, 118, 190, 115, 76, 222, 225, 185, 249, 249>>]]}, 15000]}}”, sqlite: nil}, [{Ecto.Adapters.SQL, :struct, 8, [file: ‘lib/ecto/adapters/sql.ex’, line: 554]}, {Ecto.Repo.Schema, :apply, 4, [file: ‘lib/ecto/repo/schema.ex’, line: 547]}, {Ecto.Repo.Schema, :“-do_delete/4-fun-0-”, 9, [file: ‘lib/ecto/repo/schema.ex’, line: 379]}, {Ecto.Repo.Schema, :delete!, 4, [file: ‘lib/ecto/repo/schema.ex’, line: 147]}, {Enum, :“-map/2-lists^map/1-0-”, 2, [file: ‘lib/enum.ex’, line: 1336]}, {Enum, :“-map/2-lists^map/1-0-”, 2, [file: ‘lib/enum.ex’, line: 1336]}, {FarmbotExt.AMQP.LogChannel, :handle_info, 2, [file: ‘lib/farmbot_ext/amqp/log_channel.ex’, line: 58]}, {:gen_server, :try_dispatch, 4, [file: ‘gen_server.erl’, line: 637]}]}

Yup, I have also seen these down here in Australia recently.

Is this machine of yours an Express model ?

1 Like

@Ascend
I’ve seen these in the past but only via SSH, not in the web app. Are you experiencing any changes in performance as a result of this message?

I’m running a selfmade Genesis running on a Rpi 3b+.

This usually comes up when performing sequences. When this message comes up, the device seems to reboot or restart something as I can see that the firmware gets reflashed and pin modes are set. I’m still suspecting a connection issue even if my device shows 70 - 90% WiFi, but there is as repeater between my router and the device, which might lower the actual connectivity. Maybe I’m using the meta function too excessively that triggers the autosync too fast?

There does appear to be an issue with using “too much” meta ! I can reproduce crashes and reboots with just one group of 150 weeds each with a single metadata item. ( RPi0W on FBOS 10.1.3 )

|edit|
Hmmm . . can’t reproduce using same sequences with RPi3B+ on FBOS 10.1.3 :confused:

I’ve already deleted all my saved weeds weeks ago, so I’m just having 92 plants with a simple “watered=true/false” meta state. There are still some things left that I can try now:

  • switch WiFi band from 2.4GHz to 5Ghz
  • increase the wait timer between the meta data updates, so it has more time so sync
  • try to run the sequences completely without those meta data updates

Update:
Changed to 5GHz network, no change at all (as expected). Increased and decreased wait timers in sequences, error still comes up sporadic after 4-10 plants being watered. The issue also appeared when simply homing the device or clicking on “synced” which triggers a manual sync. So I don’t think that this is caused by a huge data traffic like writing meta data. Also the device does not reboot every time, sometimes the error comes up and the device keeps running.

I’ll check my network quality again. I don’t think that this is an issue caused by FBOS or WebApp as my setup was working a week ago and no one else seems to have a similar issue. Thanks for assistance so far :slight_smile:

1 Like

For reference, we are aware of performance issues with groups larger than 60 that use the MARK AS block. We will fix this issue, as we know there are plenty of valid use cases where someone would expect to perform a MARK AS operation on more than 60 plants. In the meantime, the performance issue is still unresolved and we advise users to break up large operations into smaller chunks that are spaced out over time.

@Ascend Please let us know if you find anything in your investigation. This sounds somewhat similar to an issue reported by @jrwaters but it is too soon to say for sure.

1 Like

Thanks @RickCarlino.

If this capture may help, the little RPi0W actually Factory Resets like this screenshot
In all Factory Resets I’ve seen, the root problem is a call timeout on Repo.Pool checkout

Thanks @jsimmonds and sorry for the slow reply- it’s been a busy week for me. I will take a look. :+1:

@RickCarlino,thanks. Having done no deep analysis, yet, the root cause of this behaviour on the RPi0W would seem to me to be a lack of CPU available.

For this test I have

  • One sequence on a 150 points group where the sub-sequence just sets one metadata item on each point.
  • A schedule, about length180, of 30 minutely FarmEvents, each running this Sequence.

This might be beyond the capability of a little RPi0W with the current software ?
[ I’ve observed Scheduler Queue length peaking up to 17 active tasks during execution ]

Good sleuthing @jsimmonds :male_detective:

I think many of the issues noted in this last release are related to large groups, filters or MARK AS operations. To prevent further confusion while we find a long term fix, I may do a patch release next week with a warning message when groups are above a threshold, since the issue is not very obvious. I will need to do some profiling on Monday to figure out what is going on.

2 Likes

Alright, looks like I made progress with this issue. I’ve tried the following things:

  • I checked the network, used a completely different network from a friend and the issue persisted.
  • I reactivated my self hosted server to rule out that its caused by latency/firewalls or similar things. Same errors.
  • Played around with wait timers in sequences and splitted up the sequences into much smaller tasks. But the issue also came up in a sequence that watered 3 plants. It also occurred when syncing in idle state.
  • Tried different WiFi bands (2,4/5GHz) and ethernet connection directly to my router. Also tried direct LAN connection to my local server. Still errors. So its clearly not a connection issue.
  • Tried to replace the Rpi3b+ with my spare Rpi3b. Sadly it only booted up once, got configured and crashed while syncing first time. Now its bricked somehow, only bootlooping while throwing errors. So I was only able to “replace” it with a Rpi0W. When running the sequences from this Rpi, I’ve never got those issues so far. It is also a few times faster than the 3b+ which is really weird.

I’ve measured the time that both Raspberries needed to run the same sequence which simply updates the meta field of 66 plants. Both runs were made on the same WebApp account and same WiFi conditions. Someone would expect the 3b+ to be much faster, instead it crashed at half of the plant count and even took more than 3 times more time to process that. I took some screenshots for reference:

The only difference that I’ve noticed, is that the Rpi3b+ always has a yellow indicator on the SoftTempLimit, but I don’t think that this causes performance issues.

image

@jsimmonds You are the only one running on a Rpi3b+ that I’m aware of. Did you experience anything similar yet? The field CPU usage in the WebApp is usually between 2 and 6%. Disk usage is always 0% and Memory usage is at 82MB.

I’ll order a new Rpi3b+ and see if that fixes the issue. If not, it will be my new spare Rpi :stuck_out_tongue:
Sadly I’m not able to run the device with the 0W as the FBOS won’t connect to the arduino with its USB connectors.

1 Like

@Ascend that’s an impressive amount of scenario testing that you’re doing !! :smiley:

Can you please refresh and remind me what are “those issues” ?
( As you do, I also have one RPi3B+ and one RPi0W to test with. )

| edit |
I’m quickly learning that there are many subtle details in a software design that translate to very different behaviors on the RPi hardwares ( 1 logical CPU . . 4 logical CPUs , etc. )

I meant the errors that are displayed in those couple of log screenshots, like Disconnected from Log channel and Disconnected from Autosync channel. Sometimes they also resulted in a reboot. Now the bot seems to be stable running sequences that do not require an arduino to be attached.

I was absolutely lost and didn’t know where to start. So I checked everything that came to my mind.

I assume that there is something wrong with my Rpi hardware. A few weeks ago I changed the step-down module that provides the supply voltage for Rpi to a bigger one. For unknown reason, it increased its output voltage as my solar battery charged up. That might have damaged something on the Rpi. I only noticed the voltage increase, because the Rpi overheated pretty quickly. Well, mistakes were made :man_shrugging:

Au contraire ! I am referring purely to software ( FBOS ) :slight_smile:

What could be wrong with FBOS? If there is a general problem with this software/hardware combination, we would both have this issue. If it is just a configuration issue, I’d expect it to be disappear by changing the account, server and reflashing the OS.

Btw, I’ve also tried FBOS 9.2.2, exactly the same behaviour.

Application “capacity” metrics to start with :neutral_face: e.g.

Use FBOS 10.1.4 on both target platforms :

  • RPi3B+ easily handles > 2000 Farm Events plus 180 Points with metadata values

  • RPi0W can barely handle 200 Farm Events plus 40 Points with metadata items
    When capacity exceeds RPi0W limits, FBOS then Factory Resets ! ( lack of CPU ? )

Put another way, FBOS currently does not scale “gracefully” with the 1-CPU platform.

|edit|
I need to review your observations. I think I’ve missed important detail :neutral_face:

In my testing scenario were 300 farm events and 90 points with 1 metadata each. Rpi0W handled the testing sequence perfectly and Rpi3b+ ran super slow until the connection aborted.

Short version: Rpi3b+ was running fine and fast almost one year. Now it processes sequences really slow and throws a connection timeout (see log screenshots). Even old FBOS versions are not working.

Had a closer look at your aggregated screen shot image.
When I look at my Farmbot Logs in the my.farm.bot Web App, I see monotonic time ordering with newest at top, however, in the image you posted I see RPI 3b+ logs with very erratic timestamps !

Alright, I’ve got to admit that I messed that up badly. Sorry for that.
Here I tried to make the logs more understandable and ordered them the same way they would be shown in the WebApp. Since the logs are a bit noisy with those childsequences calls, I’ve cut out everything between the first and the last subsequence call. Does this even help to understand? :slight_smile: